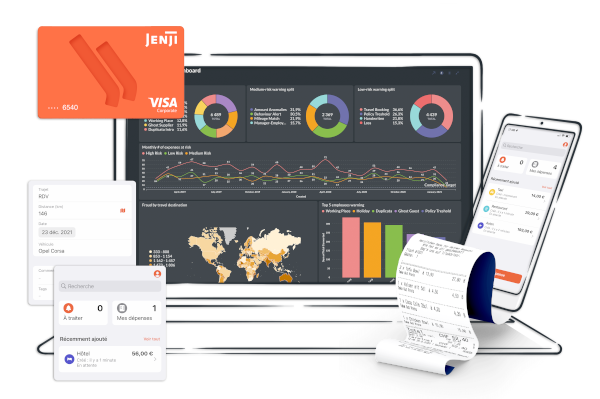
Jenji, votre logiciel de notes de frais
Plus de 40 000 organisations font confiance à Jenji


.png?width=340&name=Integrations%20(1).png)


quatre étapes
Comment gérer avec succès ses notes de frais ?

Rédiger une politique de dépenses claire
Il est essentiel d'avoir une politique de dépenses formelle pour votre entreprise. Elle aide avant tout l'équipe dirigeante à déterminer comment les collaborateurs peuvent utiliser l'argent de l'entreprise.

Proposer des modes de paiement adaptés
Être vraiment efficace dans le contrôle des dépenses des collaborateurs n'est pas simple. La meilleure solution est de leur proposer un mode de paiement sur mesure qui allie flexibilité et sécurité.

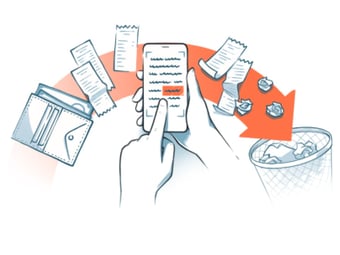
Numériser et automatiser les processus
Pour accélérer ses processus et éviter de perdre du temps à collecter les factures, il est intéressant de numériser la collecte des reçus. Les reçus électroniques sont acceptés légalement dans le monde entier.
Jenji Pay
Paiement simplifié
Comment éviter les retards de soumission et avoir le contrôle sur vos transactions ?

Sécurisez vos paiements
Jenji Connect
Portail personnalisé
Un nouveau collaborateur rejoint votre entreprise ? Jenji Connect vous permet d'ajouter facilement un nouvel utilisateur à votre compte Jenji en quelques clics.

Voir comment cela fonctionne
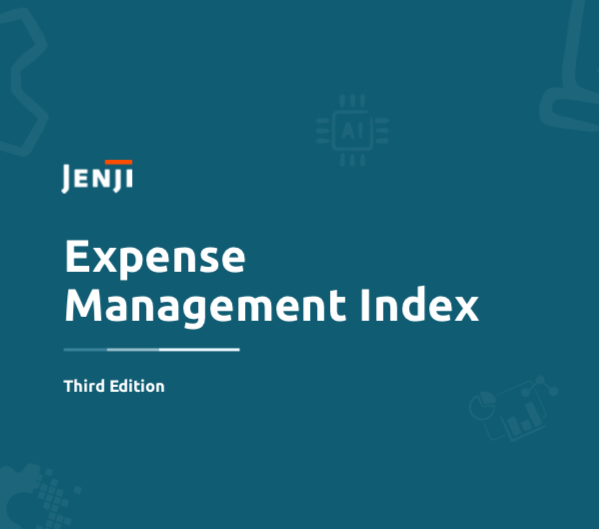
EXPENSE MANAGEMENT INDEX #3
De la gestion des dépenses à la mobilité durable
Jenji lance son troisième Expense Management Index et met à l'honneur la question des déplacements verts et son évolution.
Obtenez de nouvelles analyses clés du secteur de la gestion des frais grâce au dernier indice Jenji !


DÉCOUVREZ notre guide
Guide de la note de frais
Si vous êtes chargés de mettre en place une stratégie de gestion de note de frais pour le compte de votre entreprise, si vous êtes à la recherche d’un outil de gestion de note de frais qui vous facilite la vie, ce guide est pour vous.
Pour tout savoir sur la note de frais